

Would you get a bigger budget if you could show that your CRM and MA efforts directly contributed to 1 million SEK more in sales, a 20% higher retention rate and 10% more cross-sales? Of course you would!
Using (and understanding) control groups is crucial to prove the impact of marketing. The fear of "losing sales" is just a myth. The only thing you get rid of is the uncertainty and what you get is proof of your performance.
In this post, I share how to effectively use control groups in Braze.
TL;DR
-
Control groups prove impact and improve communication.
-
Using Conversion Events (e.g. purchase) allows you to analyze more than just clicks and opens and improves the usefulness of control groups.
-
Read the results: make decisions based on uplift % and results that are statistically significant.
-
Log each test and run monthly reviews with your team to discuss results and document lessons learned.
|
A control group in Braze is a randomly selected percentage of the segment that does not receive the campaign. The comparison between the test and control group shows the real, incremental impact of the campaign. |
Why you need control groups
A control group is a random sample of your segment that will not receive your communication, whether in a Campaign or a Canvas. Braze handles the selection itself and ensures that it is a random sample.
With the help of a control group, you can see the effect of the individual campaign or journey. The theory is very simple. Some users in yours segment, regardless of your communication, would have done what you want to measure anyway (be it purchases, listens, logins or whatever else). Measuring the difference between the control group and the rest of the segment gives you a picture of how effective your campaign or journey is.
Three reasons to always use a control group:
-
See the impact - you see if the campaign/trip makes users 'convert' or if they would have (or not) done so anyway.
-
Learn faster - by seeing the impact of your communication, you as a team and organization can optimize based on facts, not feelings.
-
Budget optimization - stop spending time and energy on campaigns that never work and focus on new things or improve what works.
Using control groups in Canvas & Campaigns
Braze gives you two ways to use control groups - Control Groups in individual Canvas/Campaigns and Global Control Group (which you can read about here). Here's how to turn on control groups in Campaigns and Canvas.
Canvas
-
First, define one or more Conversion Events (e.g. purchase). These are the metrics that Braze then uses to show the difference between your variations (legs of the journey) and the control group.
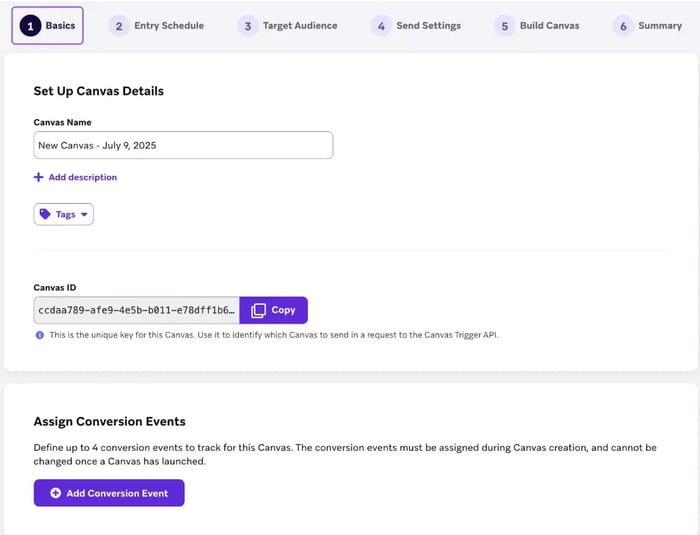
-
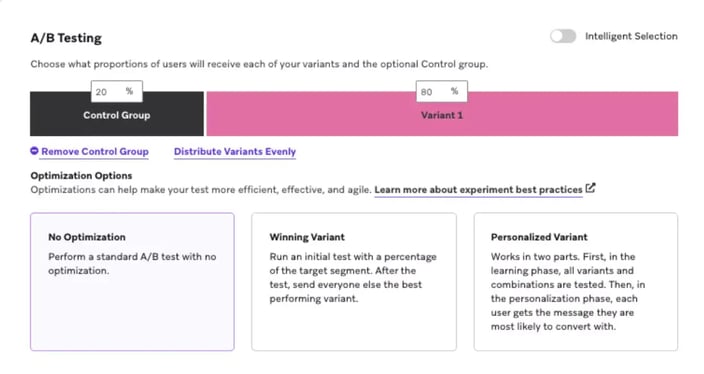
In a Canvas, select + Add Variant and then Add Control in the builder that you get to through the Build Canvas step.

-
Click on the new variant to bring up the menu and set an appropriate percentage, e.g. 10% to start with. More on how to set a size in the next section.

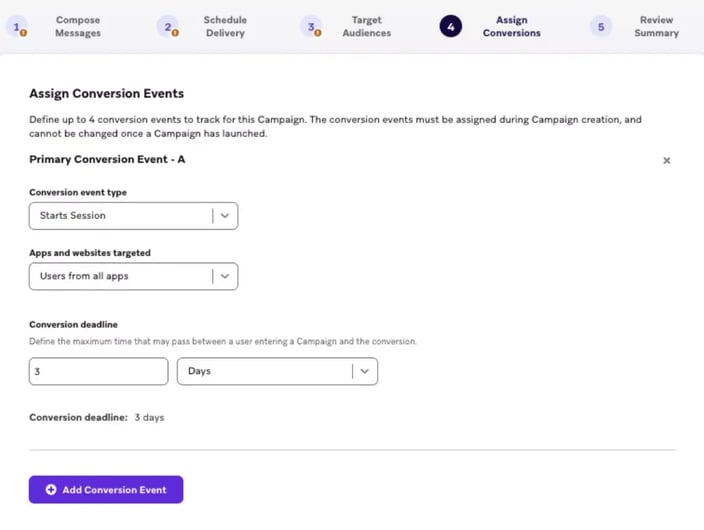
Campaign
- Under Target Audiences, set whether you want a control group and its size in percentage.
- The next step is todo just that under Assign Conversions . Here you can select up to four Conversion Events.
Calculate the right size of the control group
So what size does the control group need to be to give a (statistically) significant answer? Well, we can start with a few rules of thumb to get a feel.
|
Segment size |
Proposed % control group |
Why? |
|
< 2 000 |
10-20 % |
At low traffic, a larger proportion is needed for significance. |
|
2 000 - 20 000 |
5-10 % |
Balance |
|
> 20 000 |
1-5 % |
High volume gives results even at low %. |
But this is far from the whole answer. The size depends not only on the number of people entering a Canvas but also the conversion rate of the Conversion Event we have chosen, how much difference in results you want to be able to measure and how long you have to wait to get a response.
If the conversion rate is lower, we need a larger volume. If we want to see a smaller change, say 5-10%, we need a larger volume and vice versa.
Remember, it is not the percentage itself that is important but the number it represents.
A good tool I use myself is Optimizely's A/B test sample size calculator. Let's take a sample size to illustrate the numbers and the choices it presents to you as a marketer:
Philles Fisk sells fishing rods and knows that in their general campaign emails they convert around 1% (purchase). They have never used control groups before. Now they are planning a new campaign and want to use a control group as well.
They think that if their mailing has any effect against not sending anything at all, it should be above 20% so they choose the minimum detectable effect (MDE) 20%. They also want to be pretty sure that it is not chance that caused the result and therefore choose to set the statistical significance at 95%, which is standard anyway.
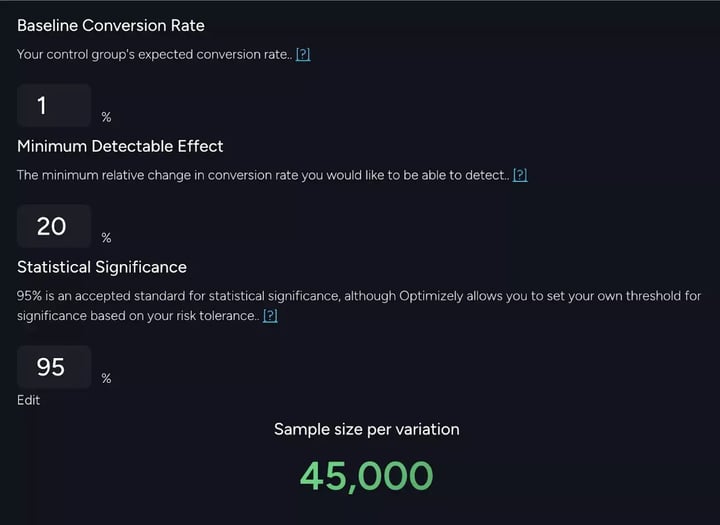
Wow, 45 000 in each variation!
If we ignore the fact that 45 000 is a lot, what does it mean to have "45 000 in each variation" when we are talking about a mailing and a control group? Do both the mailing and the control group need to be 45,000 and do you always have to have a 50/50 split?
No, it's the smallest group that has to reach that total. So whether it's a 95/5 or 80/20 split doesn't matter.
Back to the marketer at Philles Fisk. They have a base of 150,000 people. 45,000 people in the control group represent 30% of the entire base. That's a bit of a lean number! So what can you do as a marketer?
You as a marketer can e.g:
-
Accept a smaller MDE - changing it to 30% lowers the number to 19,000 or about 13% of the base. You can certainly justify that. The trade-off is that if the campaign has an effect below 30% against nothing, you will not be able to see it.
-
Lower the significance level to 80% - accept that there is a 'one in five' chance that the response you get is due to chance and not the new campaign. For example, for weekly or bi-weekly mailings, this is a good trade-off as you can get an overall picture - a trend even though an individual result may be due to chance, it is unlikely that a majority is.
It may seem complicated. Document which numbers you see most often and you'll quickly build up a sense - after a few rounds it will become routine! The important thing is to know why you do what you do.
How to read the results
Once you've set it all up, you need to read the results. You'll find the numbers in slightly different places and it looks slightly different depending on whether it's a Campaign or a Canvas.
Campaign
-
In Campaign Details, you will see an overview of how the campaign performed, which also includes your primary Conversion Event.

-
If you scroll down, you will see another view that includes engagement figures plus Confidence . In the example image we see that it is very low, 8.75%. Most likely due to the low conversion rate - 0.16% (91 conversions).

-
Below that we find the Conversion Event Details. Here you can see an overview of all Conversion Events if you have more than one.

Canvas
-
At the top we find Canvas Details which gives an overview of how the journey is performing. In the right corner of the Conversion Rate (which shows the total "conversion" if you have multiple Conversion Events), you can pop up another window with additional details. Here you can see the specific numbers for all the Conversion Events you used.


-
The next place to see the conversions is a little further down the journey. There, in the first step, you can see a summary of the conversions for that branch.
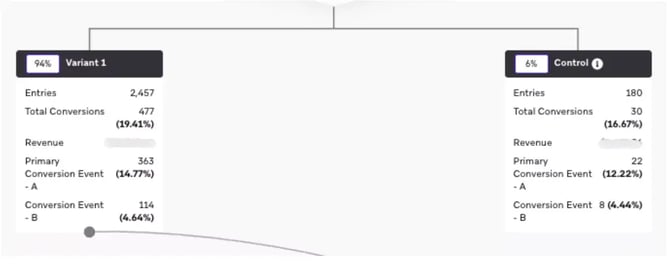
-
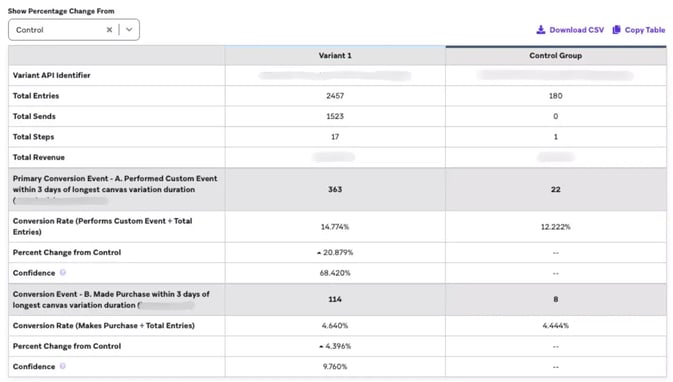
For the most interesting view, click on Analyze Variants at the bottom left. Here you will see the most detailed breakdown of how different Conversion Events perform against your control group and different variants in the journey.
Make analytics part of your process
The most important thing (which many people also forget) is to integrate the analysis of your campaigns and journeys into your work process. Without it, there's no good way to make sure it gets done, month in and month out. You also don't have an easy way to ensure that results and conclusions are documented. What I recommend is a monthly meeting where:
-
You and your team go over the month's campaigns and when appropriate, trips.
-
You highlight interesting figures and discuss. What worked? What did not work and why? This way, you can effectively come up with new ideas and share knowledge.
-
You also write down your findings. Also ideas for future tests.
A simple framework covering these points is a good way to hang up everything we've gone through. Exactly what it looks like and how often, you know best.
Summing up
In conclusion, this isn't about cramming in another feature; it's about giving you and your team a competitive edge when you talk numbers. The next time someone asks "Do those mailings really work?" you have the answer. Why not start today? Good luck, and get in touch if you want to talk Braze, data-driven marketing or anything else!


_new.webp)